Seminar Sum-Up: Hutton Club 5/10/18
On 5/10/18 I attended a seminar hosted by James Lea from
the University of Liverpool: ‘Insights into tidewater glacier behaviour from
Greenland wide mapping and ‘novel’ stability analysis’. I really enjoyed how
the seminar focused on simple and accessible science but with techniques that
are still just as effective. I think it is so important to prove science is
ready and available for all and hopefully more seminars like this will inspire
people to give research a go!
The seminar focused on two new ways to map and analyse
tidewater glacier behaviour, one focused on mapping ice margins and the other
on recognising the stable and unstable areas of a glacier both techniques are applied to Greenland glaciers.
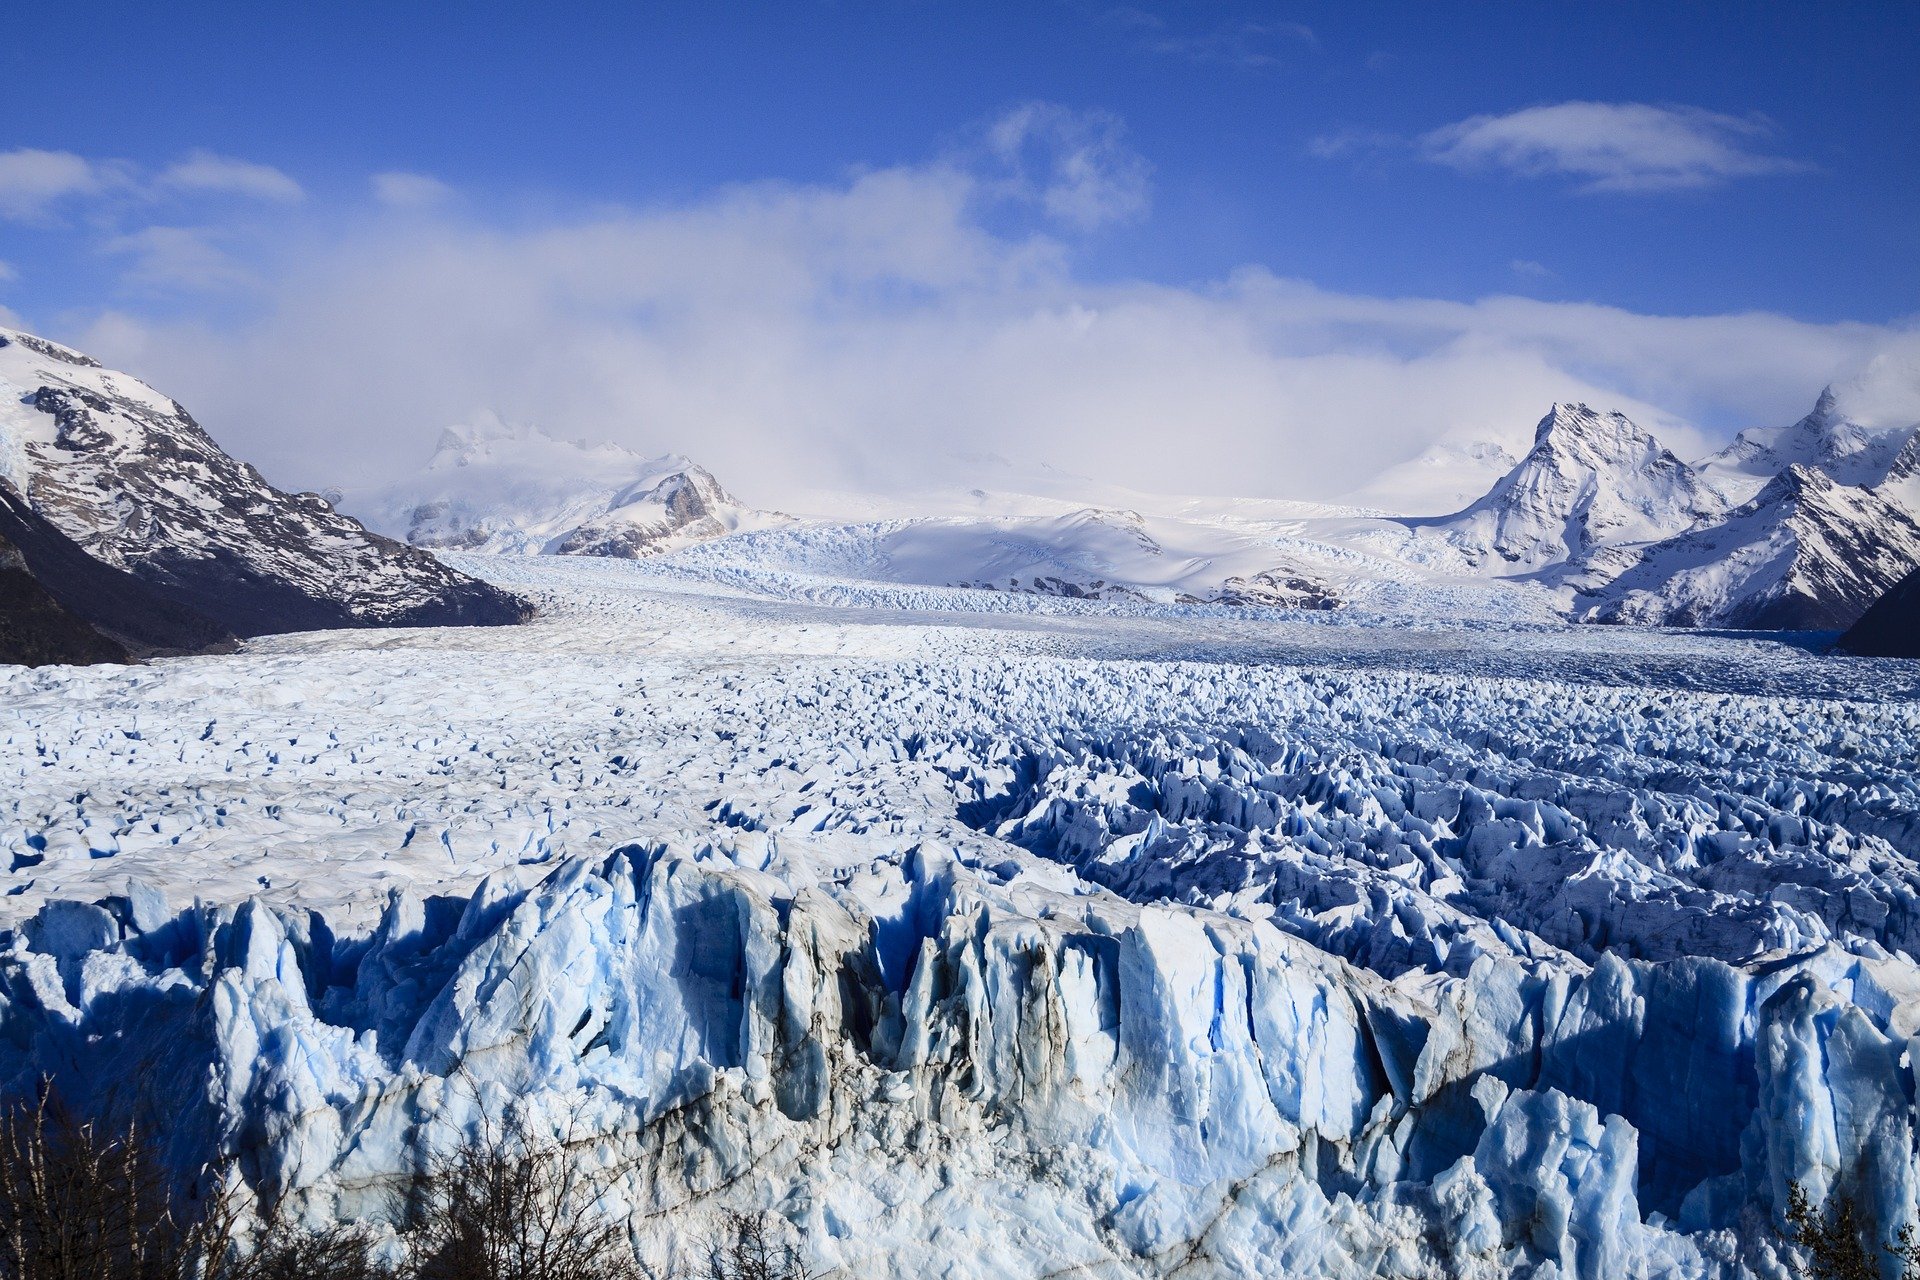
Fig 1: Ice Calving at Helheim Glacier (https://timeforgeography.co.uk)
Technique one is currently being tested by James’ PHD
student Dominik Fahrner and in principle he is using an add on to the free
source Google Earth Engine (GEE). James has created a Digitisation Tool for GEE
that allows access and processing to landsat and sentinel satellite imagery in
seconds. Dominik has been working to digitise ice margin observations for the
last 60 years and has completed 3923 points in less than one month which is a
rapid amount of time to potentially quantify margin change for glaciers.
The results allow a comparison of retreat and advance rates
between glaciers in different regions of Greenland. The south-east, south west
and north-west regions show a linear trend of retreat from the mid-1990s and
this generally agrees with literature. But why is a linear trend of retreat seen
and can this be explained by climate data? The NW region could correlate
increased retreat rates with high positive anomaly air and sea temperature
values but in general more research is needed to provide definite conclusions.
The NE region showed instability from 1978-2003 and
acceleration of this around 2008 which contrasts with previous reports of
instability from only the 2000s. This area has generally had positive anomaly
air and sea surface temperatures throughout the last 30 years and this could be
a reason for the unusual results. It is also possible this trend has only now
been spotted due to this technology that has allowed more glaciers in the NW
region to be analysed than ever before.
However, this technique assumes all glaciers are equal and
fjord geometry is of no importance and these are both untrue so as always
with science there is a high amount of uncertainty.
Overall, glaciers in all regions follow a similar retreat trend
onwards of 2008 if this is not a coincidence it could provide an estimation of
future retreat rates– giving empirical retreat estimates for all Greenland
Tidewater margins and a rough timeframe of the processes.
Technique two in contrast assumes fjord geometry is very
important – as glaciers retreat they step back in jumps from unstable areas to
more stable ones in accordance with the geometry. James has taken a complex equation
by Schoof and transformed it into a simple point model that can identify areas
of stability and instability in the fjord independently, so without field observation
the glacier movement can be predicted as it is expected to retreat or advance
to the next stable point.
This technique has been tested on previously observed glaciers,
Helheim, seen Fig 1, and Kangerlussuaq. Both have shown the actual observed
glacier movement matches the stable areas identified by James proving his technique works.
Uncertainty however is present as it relies on very accurate topography which can be difficult to find. Despite this, it provides a
relative indicator of stability and where it is relatively more likely the
glacier will move which can be used to predict the next retreat or advance.
But Why is This Important??
Both these techniques are new and provide a simple but very
effective way to analyse tidewater glacier activity. Looking to the future
these technological advances could prove very useful in predicting glacier
retreat and in response predict ice calving events which are very important as
they contribute significantly to sea level rise. GEEE can also be applied to
geomorphology and topographic analysis for flood and landslide hazard and so
this seminar highlights how versatile these seemingly simple programmes can be.
-Meg


Comments
Post a Comment